nav-close
float feedback icon livechat
RM SOCIAL: FUNCIÓN DE COPY TRADING YA DISPONIBLE
EL MEJOR ALIADO PARA
TU TRADING
Acceso a +350 productos como Forex, Acciones, CFDs, Commodities, Índices y Metales con plataformas de MetaTrader 4/5.
LIVE SPREADS
EUR / USD SPREAD
0.00
COMPRA ----- VENTA -----
XAU / USD SPREAD
0.90
COMPRA ----- VENTA -----
EUR / JPY SPREAD
0.10
COMPRA ----- VENTA -----
USD / JPY SPREAD
0.00
COMPRA ----- VENTA -----
GBP / USD SPREAD
0.20
COMPRA ----- VENTA -----
Los precios Live son orientativos
MEJORA TU TRADING VIAJA CON NOSOTROS
Opera como nunca antes con nuestras características óptimas. Nuestra plataforma perfecta y fácil de usar permite navegar por los mercados con facilidad.
an icon says 0.0 pips, a feature of radex markets #01 Spreads desde 0
an icon says 0.0 pips, a feature of radex markets #02 350+ Productos disponibles
up to 1:500 leverage #03 Hasta 1:500 Apalancamiento
3 base currency icon #04 3 Monedas Base
your account manager icon #05 Su propio gestor de cuenta
live support icon #06 Asistencia en vivo 24/5

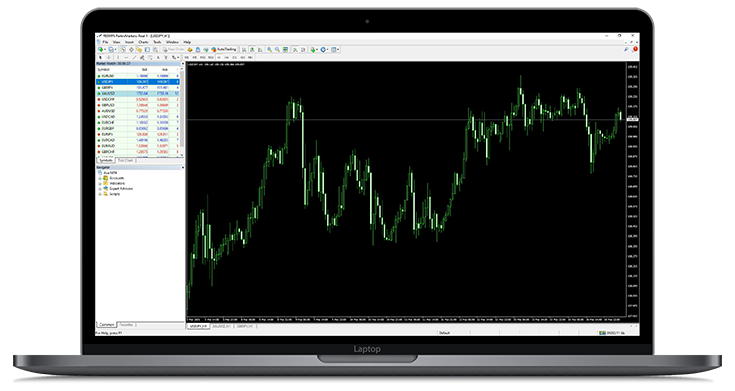
a PC for using MetaTrader, a forex platform

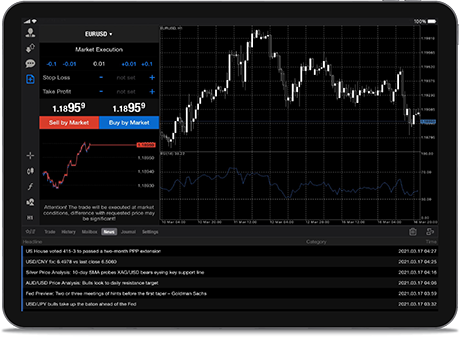
a Pad for using MetaTrader, a forex platform

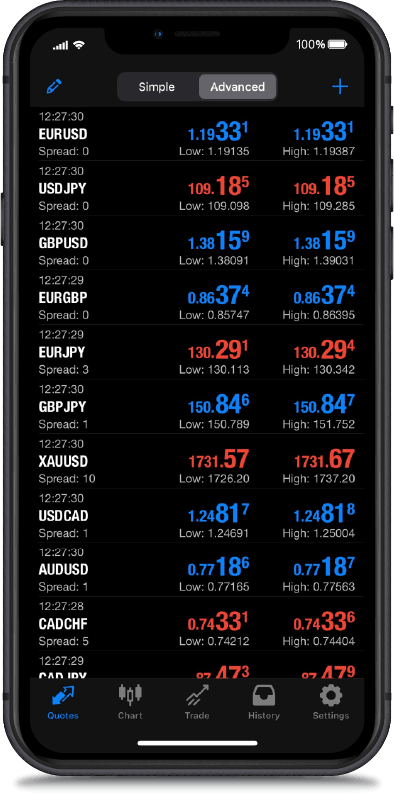
a cellphone for using MetaTrader, a forex platform

ENCUENTRE SU PROPIA VELOCIDAD EN TRADING

EN RADEX MARKETS
Ofrecemos una amplia variedad de plataformas
que se ajustan a sus necesidades.

MARKET WATCH
Market watch: 27th September 2024
septiembre 2024
Gold simply refuses to stop hitting new highs. Yesterday marked the latest step on the record-breaking path, which saw the precious metal reach highs of $2,685 per ounce on the intra-day. There are a number of bullish arguments for bullion at the moment, as central banks around the world begin to cut interest rates in earnest, with the promise of more to come. Silver also made a bold move on Thursday, stepping up to $32,71 an ounce before settling lower. Traders would have to go all the way back to 2012 to see those same prices. Another factor is of course the recent stimulus package courtesy of the People’s Bank of China, which is also working wonders for the Hang Seng Index, which surged over 4% yesterday to levels not seen since August of last year. In the US, the S&P 500 index closed 0.4% higher on Thursday to a new record high of its own. The Dow Jones Industrial Average and Nasdaq Composite also fared well thanks to better-than-expected economic data, both gaining around 0.6% on the day. The record-breaking trend even extended to Europe, where the German DAX also hit an all-time high after climbing 1.7% over yesterday’s session. The week is not over yet however, later today the PCE price index will attract a decent amount of attention, not least from the Fed itself. If proposals for further rate cuts are to be believed then the latest batch of inflation data will certainly factor into future decisions.
LEER MÁS
RM NOTICIAS
Temporary Service Hours Change Notification
06 septiembre, 2024
Hi there!Please be informed that there will be a temporary change in our service hours due to system updates.  Between Friday to Sunday, there may be a delay in getting back to you. You can always send us an email and we'll do our best to respond as soon as we can.We apologise for any inconvenience this may cause and appreciate your understanding during this time. We will provide updates as soon as our regular service hours resume. Thank you for your patience and continued support.
LEER MÁS
CALENDARIO ECONÓMICO
( GMT +03:00 13:06 )
March 26, 2024
2024-09-29 23:00:00+00:00KRProducción industrial m/m Ago
2024-09-29 23:00:00+00:00KRVentas minoristas m/m Ago
2024-09-29 23:50:00+00:00JPVentas minoristas m/m Ago
TRADER'S PICK
Financial basics: Manufacturing PMI
septiembre 20, 2024
Open up the economic calendar and chances are you will see some mention of manufacturing PMI data. They typically attract the same attention as other publications such as GDP, employment figures, inflation numbers and the like. But what exactly is a manufacturing PMI? PMI stands for Purchasing Managers’ Index. A PMI is a diffusion index, which is a tool used in economics to evaluate the general trend of a series of data points. It works by looking at the direction of each component in a group and then telling us what the overall direction of the group is. For example, let’s take a group of ten businesses to evaluate their overall growth trend. Nine report a 10% reduction in activity; one reports a twofold increase. In this instance, calculating the average growth would give us a positive figure, which is true, but ignores the fact that most of those businesses are in decline. A diffusion index on the other hand would instantly let us know that the overall trend is firmly negative. In the case of the manufacturing PMI, the figure is calculated according to the following formula:                                                                                        PMI = [G × 1] + [NC × 0.5] + [D × 0] Where: G: Percentage reporting growthNC: Percentage reporting no changeD: Percentage reporting decline How are the above data collected? It is actually as straightforward as asking people in key industrial positions what they observe, typically on a monthly basis. A PMI is essentially the result of survey data. A corporation or government body will contact senior executives working at hundreds of companies across all sectors of industrial activity and ask them for specific information about their company’s performance. The information in question revolves around new orders, inventory levels, production output, supplier deliveries and finally employment within the company. Once everything has been collected, the overall PMI figure can be calculated based on the number of businesses reporting growth, contraction or simply no change at all. A PMI above 50 indicates a sector in expansion; a PMI below 50 indicates a sector in contraction. You may be forgiven for thinking that the above methodology does not sound very scientific or objective. There will obviously be errors involved, inaccurate information, inherent biases on behalf of the reporting staff etc., not to mention the fact that the companies surveyed may not necessarily reflect broader industrial trends. On top of that, the exact way of collecting and processing the data may vary from country to country. These problems are by no means limited to PMI data by the way. For example, inflation and employment statistics face the same hurdles and often undergo significant corrections in the months following publication. If anything, PMI figures are some of the more reliable on the economic calendar. It is a relative measure after all; the question really boils down to “is this month better or worse than the previous one”. Given that they provide new information relating to industrial trends, PMI data are considered leading indicators, offering insights into the economy before they manifest in the labour market or in GDP figures for example. The credibility of PMI figures is further bolstered by the fact that huge entities such as S&P Global publish such data on an international scale, harmonising the process across many different areas of the world. Indeed, S&P Global covers 45 distinct economies, allowing for more consistent comparisons to be made between different countries. Many countries will have several different bodies that calculate PMI data, such as the Institute for Supply Management in the US for instance, which publishes alongside the S&P Global but uses a slightly different methodology. In China, the National Bureau of Statistics and Caixin Indices both convey PMI data, with the former focusing on larger and state-owned enterprises and the latter being much broader in scale. Of course, a PMI is not limited to the manufacturing sector. Similar calculations are made for other areas of the economy, such as the service or construction sectors. Services are in fact a much larger contributor to GDP than manufacturing, particularly in developed countries, so why the focus on manufacturing? Tradition is a large part of it; the manufacturing PMI dates back to the 1940s and predates the service index by half a century. It is also considered the more concrete of the two, given the more nebulous nature of the service sector. Fundamentally, most of us probably attribute more value to building airplanes than to ordering cappuccinos from each other, a stance which underlies much of the criticism of the aforementioned GDP figures. Whatever the reason, manufacturing PMIs remain a staple of the economic calendar and this is unlikely to change.
LEER MÁS
LiveChat
livechat

Advertencia de riesgos : Productos derivados del trading y productos potenciados poseen un nivel más alto de riesgo.

ABRIR CUENTA
to top icon