ความรู้คือพลัง
ไม่ว่าคุณจะเป็นมือใหม่หรือเทรดเดอร์ทุกวัน เราขอแนะนำให้คุณใช้แหล่งข้อมูลของเราเพื่อเรียนรู้และพัฒนาเทคนิคการซื้อขายของคุณต่อไป ให้ความช่วยเหลือในการเริ่มต้นและนำการซื้อขายของคุณไปสู่อีกระดับ
Forex is one of the largest trading markets.
Forex (foreign exchange market) where one currency is traded for another currency. Some traders are just looking to exchange their currency for a foreign currency, although most are currency traders, which means they watch the movement between currencies and speculate on the upcoming exchange rates and their movements, very similar to traders that speculate on the stock market.
Price movements on the exchange are normally the result of a countries cash flows in addition to global economic conditions. Most news that impacts the market is released publicly, this allows traders to receive the information at the same time to reduce insider trading.
Currencies are traded against each other and represented in currency pairs Example: ''EUR/USD in this pair EUR (Euro) is the first currency, and USD (U.S. dollar) is the second currency. So if you were to trade EUR/USD one unit would be shown at the current exchange rate 1 euro = 1.21 USD.''
Forex has long trading hours 24/5, open Sunday evening until Friday evening.
Only a select number of new traders understand the advantages of trading FOREX. This market is becoming a popular choice due to the advantages that you don't get in other markets.
Below we have listed a few key points of the benefits that traders gain when trading FOREX.
1. Low trading cost.
Unlike other markets, FOREX traders do not pay government fees, clearing fees, and exchange fees.
In Forex brokers make their profits from the difference in the bid and ask price.
2. Flexible trading size.
Traders can trade from as low as 0.01 lots, which means you can also trade with a smaller fund, making the market available to most.
3. 24/5 Market hours.
The Forex market is open day and night Monday to Friday, which makes this market a good choice for part-time traders who have limited time to trade.
4. Leverage.
Even traders who have small deposits are able to trade larger contract sizes due to the leverage most brokers offer.
Trading FOREX can give the opportunity to get to financial freedom, but there are definitely risks involved.
Below we have listed some reasons why day trading is so popular.
1. No matter your background you can get into the industry, with a lot of tools and materials online with a bit of research and self-education you can become a trader.
2. Work for yourself and control your investment choices.
3. Work/Trade from anywhere with most trading platforms available on mobile applications now, you are not restricted to sitting in front of the computer to trade.
4. Flexible trading hours, as FOREX is 24/5 you can trade when your schedule allows the time, making the market accessible to most.
5. You don't need big sums of money to start your trading business.
6. Fast movement of money you can place a trade and convert to the currency you are trading in seconds, allowing you to get in and out fast.
7. Low fees for your trading allowing you to keep more of the profits.
8. Not many tools are needed to start, you just need internet, a computer, or smartphone, and an online broker.
When you trade FOREX, You're buying or selling in currency pairs. The currency pairs fluctuate due to the exchange rates and which currency is stronger at the time of the trade. A currency pair is shown as one currency against the other and shown as currency1/currency2, for example, if you are trading Euro against the British pound, the pair would show as EUR/GBP. The most frequently traded pairs usually contain USD and are the most liquid.
Below is a chart of the major FOREX pairs.
| Pair | Countries Involved |
|---|---|
| EUR/USD | Euro Zone/United States |
| GBP/USD | United Kingdom/United States |
| USD/JPY | United States/Japan |
| USD/CAD | United States/Canada |
| NZD/USD | New Zealand/United States |
| USD/CHF | United States/Switzerland |
| AUD/USD | Australia/United States |
When the USD dollar is not one of the currencies in the pair, the pair will be known as a cross-currency pair or minors. Below you will see the charts for Pound, Yen, and Euro pairs.
| Euro Cross-Currency Pairs | |
|---|---|
| Pair | Countries Involved |
| EUR/CHF | Euro Zone/Switzerland |
| EUR/NZD | Euro Zone/New Zealand |
| EUR/GBP | Euro Zone/United Kingdom |
| EUR/AUD | Euro Zone/Australia |
| EUR/CAD | Euro Zone/Canada |
| Yen Cross-Currency Pairs | |
|---|---|
| Pair | Countries Involved |
| EUR/JPY | Euro Zone/Japan |
| NZD/JPY | New Zealand/Japan |
| GBP/JPY | United Kingdom/Japan |
| AUD/JPY | Australia/Japan |
| CHF/JPY | Switzerland/Japan |
| CAD/JPY | Canada/Japan |
| Pound Cross-Currency Pairs | |
|---|---|
| Pair | Countries Involved |
| GBP/CHF | United Kingdom/Switzerland |
| GBP/NZD | United Kingdom/New Zealand |
| GBP/AUD | United Kingdom/Australia |
| GBP/CAD | United Kingdom/Canada |
| Other Cross-Currency Pairs | |
|---|---|
| Pair | Countries Involved |
| AUD/CHF | Australia/Switzerland |
| AUD/NZD | Australia/New Zealand |
| AUD/CAD | Australia/Canada |
| NZD/CAD | New Zealand/Canada |
| NZD/CHF | New Zealand/Switzerland |
| CAD/CHF | Canada/Switzerland |
Besides the major and minor currency pairs, there are a lot more currencies that can be traded on the FOREX market. When these exotic currencies are paired with major currencies, it's known as an exotic pair.
On exotic pairs, you will usually find that the spreads are higher than the major and minor pairs.
Chart of some exotic pairs below.
| Pair | Countries Involved |
|---|---|
| USD/HKD | United States/Hong Kong |
| USD/SEK | United States/Sweden |
| USD/SGD | United States/Singapore |
| USD/NOK | United States/Norway |
| USD/ZAR | United States/South Africa |
| USD/DKK | United States/Denmark |
| USD/THB | United States/Thailand |
| USD/MXN | United States/Mexico |
Analysing the price in FOREX can look complicated for new traders so it is important for you to educate yourself and spend time looking at changes in market prices. Understanding how to read the price of a currency pair is the first step. If you are looking to buy a currency, let's say 10 Euro, you need to know how much of the other currency in the pair you need to pay for it.
Example:
EUR/GBP 0.8849
This price shows you that you can buy 1 Euro for 0.88 pence (GBP) so if you want to buy 10 Euros it would cost you £8.80 GBP. This price is based on the average prices of the buy to sell for the currency price at that time, this does not include the spread between the bid-ask price set by the broker so this needs to be taken into account. The bid-ask spread is usually very low on major pairs but something to be aware of when placing a trade.
Price charts come in many different forms, but there are three most commonly used when trading FOREX. These charts are used so the trader can determine entry and exit points for the currency pairs they are looking to trade. Below is a brief description of the main three.
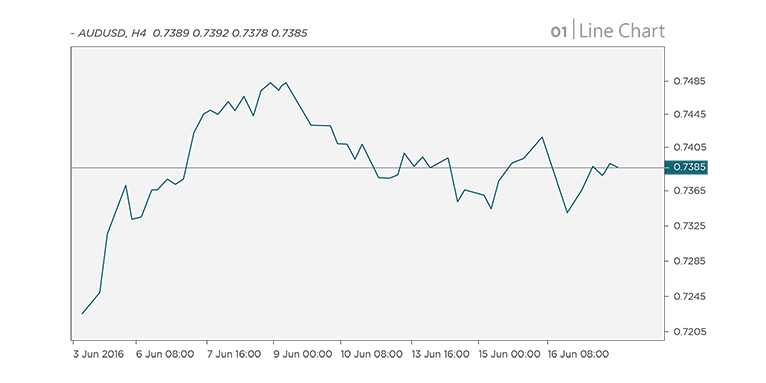
1. Line chart.
These are mainly used as an overview to see the trend direction, they don't show the individual price, and Line charts show the difference between two points in time so very useful to determine the overall trend direction.
The line chart example below:
2. Bar Charts.
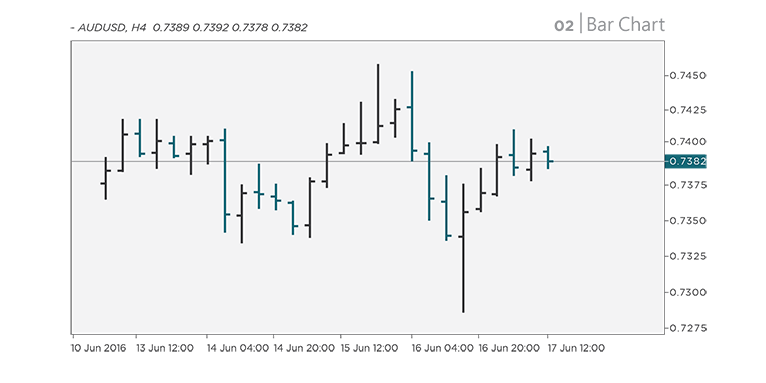
Each bar on a bar chart represents the price movement in a period of time and can be changed to many different timeframes, from 1 minute to 1 month, if you choose 1-minute timeframe each bar will represent the movement in the price for each minute, it will also show the highest, lowest and current price for each minute.
The Bar chart example below:
3. Candlestick Charts.
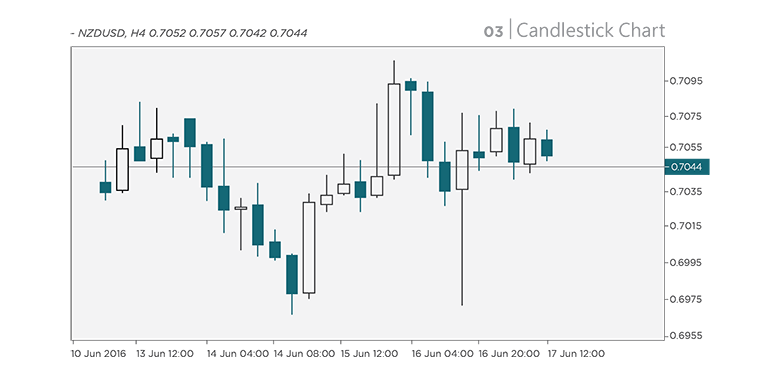
These charts give you the same amount of information as bar charts, but many traders find the layout much easier on the eyes and clear to determine the price points. Again these charts range from 1 minute to one month, with each candle representing that period.
The Candlestick chart example below:
One thing commonly used when analyzing trends in FOREX is support and resistance, you should understand these terms and meanings before you start trading.
When a market trend is bullish (trending upwards) and then it comes back down a little the highest point reached before pulling back is known as the resistance. The lowest point reached in the move before going back up into the bullish trend is called the resistance.
The support and resistance levels are not exact points, sometimes you will see the price go past your support or resistance and then return back, the market was testing the support and resistance levels these are known as false breakouts.
Normally if the support or resistance level is really broken the market will close beyond the levels. This is when it becomes useful to check out the line chart for a clear image of a trend direction as these only show the closed prices,
Key points about support and resistance:
1. When a price tests the level of support or resistance often, the resistance or support becomes stronger.
2. The strength of a support or resistance break depends on how strong the support or resistance had been before it was broken.
3. When a price rises through resistance, that resistance could possibly become support later on.

Trend lines are the most common method of technical analysis in FOREX, but they are often used incorrectly.
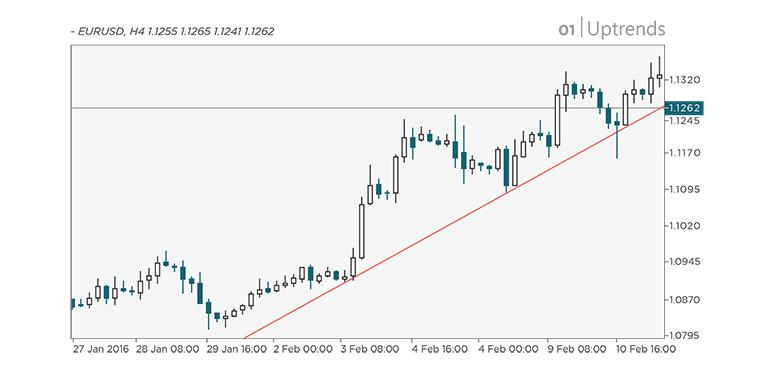
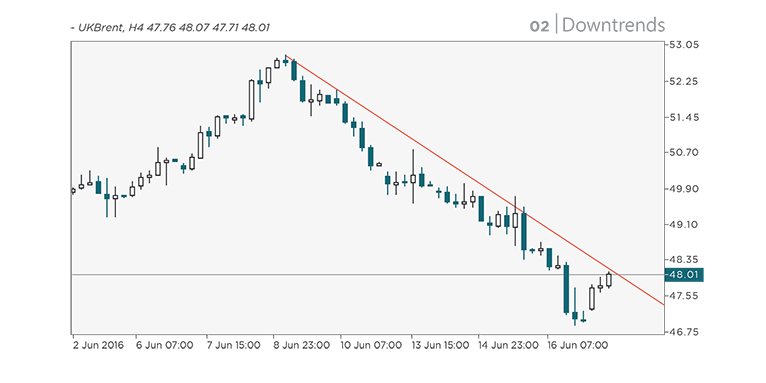
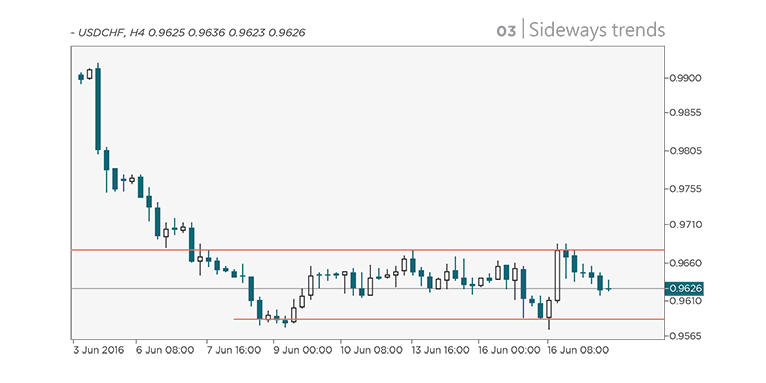
To draw a trend line correctly you should look for two strong resistance points and two strong support levels, and draw one line between the two supports and one between the two resistance levels.
Below are 3 examples of trend lines.
1. Uptrends (tracking an upward movement)
2. Downtrends (tracking a downward movement)
3. Sideways trends (tracking relative little movement either way)
The idea is to spot major changes in currency exchange rates before they happen when trading FOREX. Traders who do this well can make big profits. Many traders use chart patterns to predict when a currency pair is about to break out, and when trends are reversing, this gives the trader opportunity to take advantage of the fluctuations.
There are many different chart patterns that you might want to be familiar with, we will go through a few now.
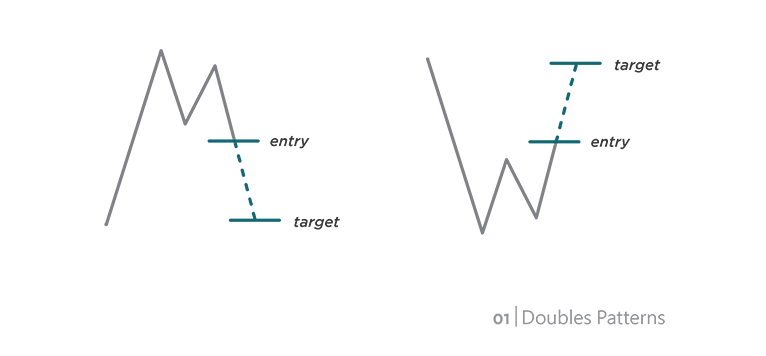
1. Doubles
Double Top and Double Bottom: these are two of the patterns you will need to be familiar with.
Double Top: this pattern is formed when the price hits a resistance then retraces, and comes back up but still can’t break that resistance creating two peaks. Usually the second peak is lower than the first peak showing there is not enough bull momentum. This is often used as a strong trend reversal signal.
Flip the Double Top around and you have a Double Bottom, it’s the exact opposite as the Double Top. You are looking for a strong down trend, then hit a resistance, retrace back up, and down again but still can’t break the resistance, the second peak should be higher than the first. This will be a strong signal for a trend reversal.
2. Head and Shoulders
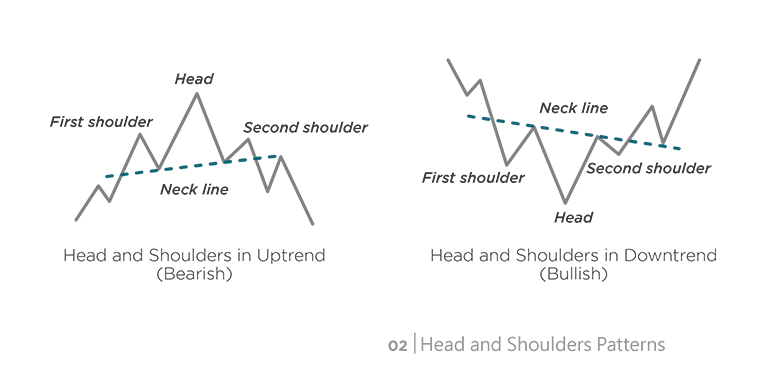
Head and Shoulders is another signal often used to spot trend reversals, it is formed by a smaller peak (Shoulder), then one higher peak (Head) at the top resistance, then another lower peak (Shoulder), You can draw a line between the two lowest points of the Heads peak, this is refer to as the neck line, traders use the neck line to confirm the head and shoulder. Traders often place enter the market once the prices tests the neck line and falls below.
If you flip this pattern you get an inverse head and shoulders, which is the exact opposite of the Head and Shoulders.
3. Wedges
Rising Wedge and Falling Wedge: these are two patterns that indicate a pause in the current trend, and is one to keep an eye on as you could see the trend reverse or a break out.
Rising Wedge: this is when the price consolidates between support and resistance lines which are moving upwards. The support line is steeper than the resistance line which signals that higher lows are forming more quickly than higher highs.
When a rising wedge is formed when the market trend is up, this usually indicates a downtrend, but if a rising wedge is formed when the market trend is down, this usually leads to continued downwards movements.
The Falling Wedge is the exact opposite.
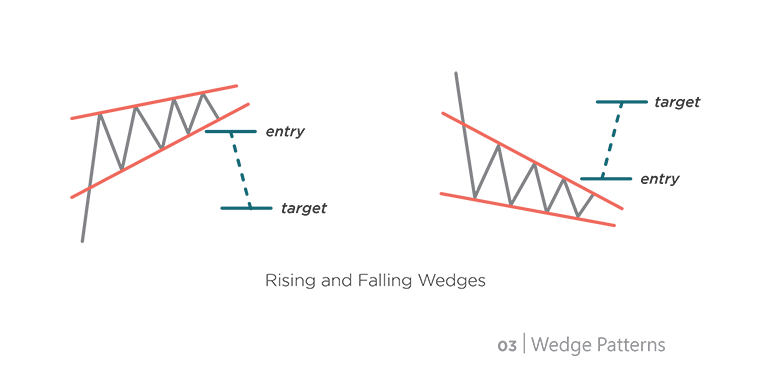
4. Rectangles
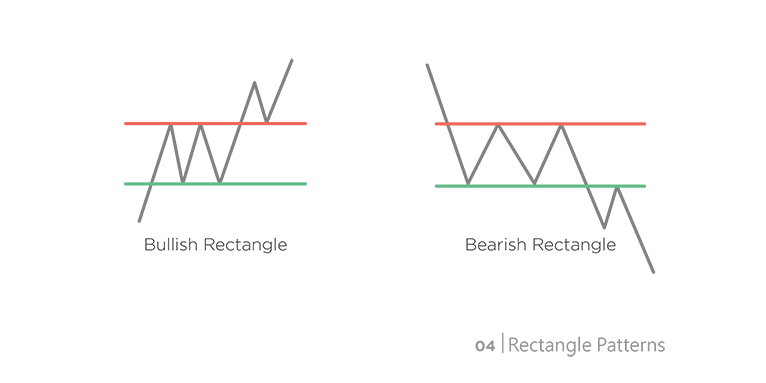
Bullish and Bearish Rectangle patterns are formed when the price has parallel support and consolidates between the two. This is usually because the price is testing the support and resistance levels before breaking out again, and is usually a sign the current market trend will continue.
As you’re getting into the swing of things, you will start to figure out what timeframe is most suitable for your trading. The timeframe is the amount of time you usually like to stay in a trade. Long-Term, Medium-Term, or Short-Term.
1. Long-term, this can be anywhere from a week to months, or years. If you are trading long-term you would more than likely keep an eye on the daily, weekly, and monthly charts and use these to analyse your entry and exit positions. The positive points on long-term trading, less transaction fees, less stress, as you don’t need to watch the charts all of your waking hours, and can set your SL and let it go. Long-term trading can be tricky as market trend reversals can happen anytime so you need to time your exit well.
2. Medium-term, this can be from hours to days, traders would usually analyse the hourly, and four hour charts for entry and exit points. The positives more trading opportunities to diversify your portfolio, but you will also pay more in spread or commission fees if you have a lot more activity. You will need to watch the market a lot more than those long-term trading.
3. Short-term, this can be anywhere from seconds to hours, most will analyse the minute to hour charts. Short-term trading gives you a lot of trading opportunities, no overnight risk, and quick results. The difficult part with short-term trading is the stress usually you will not leave the screen when trading, trying to make as much as possible and as quick as possible. Profits and losses are usually limited per trade on short-term so traders usually trade a lot more volume.
Choose the timeframe that suits your personality, goals and life best, it’s good to give all timeframes a go to see which you are most suitable.
There are many different chart indicators often used to measure market conditions and price trends. Traders often use these to analyse and predict price movement to capitalise from it. Most traders use the indicators to confirm their predictions before placing the order. Chart indicator examples below.
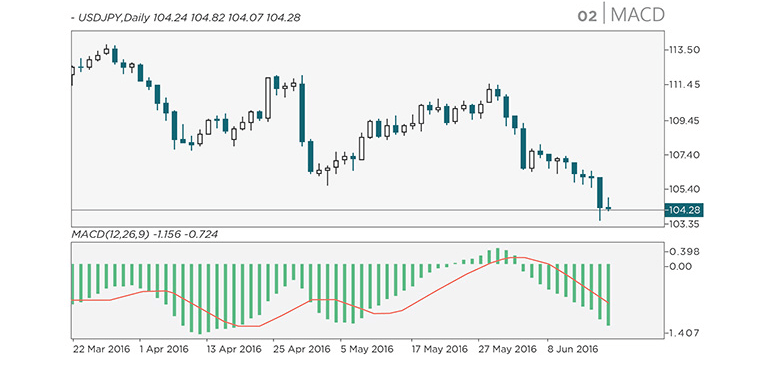
1. Moving Average Convergence Divergence (MACD)
Moving averages Convergence Divergence (MACD) is used to find a possible new trend. There are 3 numbers on the MACD chart. The first is the number of periods used to calculate the faster moving average. The second is the number of periods used to calculate the slower moving average, and the third is the number of bars being used to calculate the average difference between the faster and slower moving averages. Traders use the two moving lines at different speeds to predict the trend.
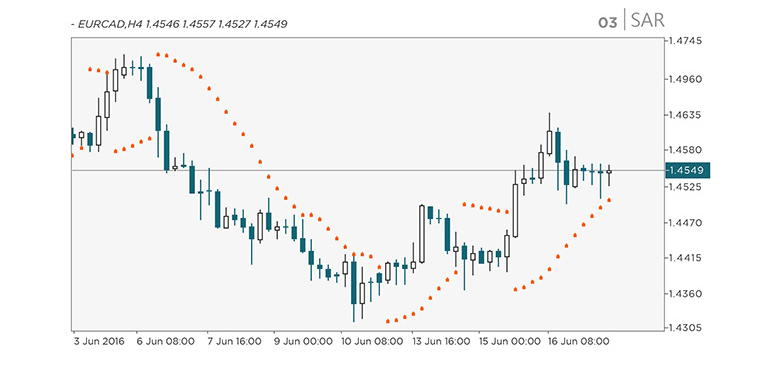
2. Parabolic Stop And Reversal (SAR)
SAR indicator is used to determine the end of a trend. Traders often use this indicator to know when to exit a trade. SAR indicator places dots on the chart that shows where potential reversals in price movements are. If the dots are beneath the candles, this is indicating a long signal. If the dots are above the candles, this indicates a short signal. SAR works best in a trending market, you should not use it in a crab market.
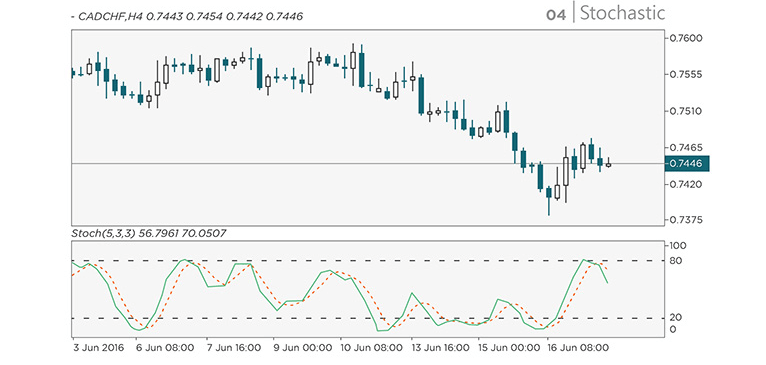
3. Stochastic
Stochastic like SAR is also used by traders to indicate when a trend could end. It measures the overbought and oversold market conditions. Using two lines measured on a scale of 0 to 100, if the lines are over 80, this indicates the market is overbought. If the lines are under 20, this could indicate the market is oversold.
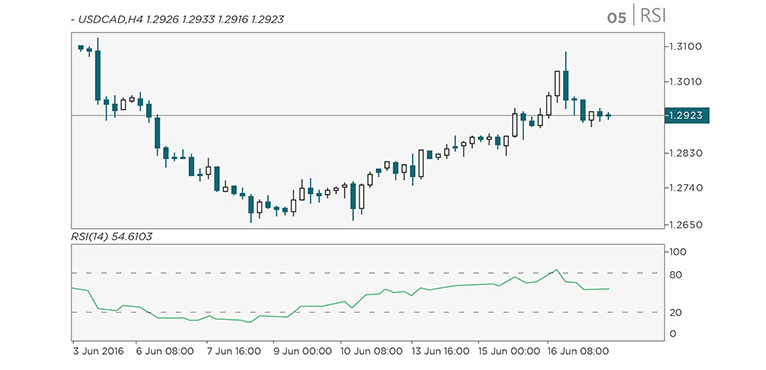
4. Relative Strength Index (RSI)
RSI indicator helps traders identify pairs that are oversold or overbought. RSI works on a scale of 0 to 100. Measurements over 70 indicate an overbought market, and measurements below 30 indicate an oversold market. Traders use this to confirm trends, if they believe it’s a bull trend, the RSI should be above 50 and bare trend below 50.
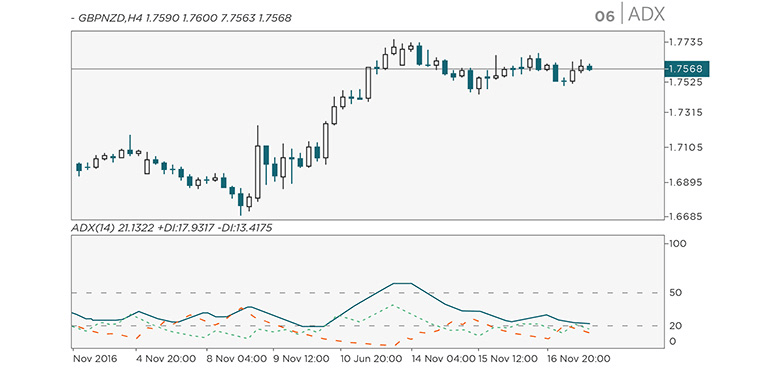
5. Average Directional Index (ADX)
ADX Indicator is used to see if a market is starting a new trend or ranging, it is measured in a range from 0 to 100. Measurements below 20 indicate a weak trend, and measurements above 50 indicate a strong trend.
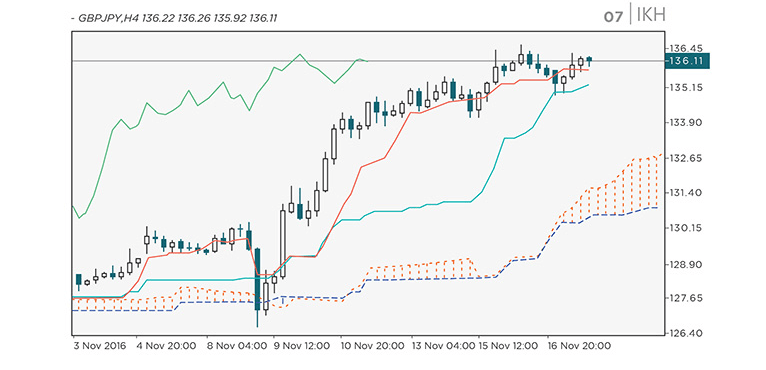
6. Ichimoku Kinko Hyo (IKH)
The IKH indicator uses 5 lines to gauge future momentum and support and resistance area. It is commonly used for JPY pairs.
The Blue line is the base line that averages the highest high and lowest low from the last 26 periods.
The red line is the turning line that averages the highest high and lowest low from the last 9 periods.
The Green line is the lagging line that is the closing price over the last 26 periods.
The Brown and Beige lines, one averages between the Blue and Red lines over 26 periods. The other averages the highest high and lowest low over the past 52 periods, and is plotted for 26 periods ahead.
In summery the IKH rolls support and resistance, crossovers, oscillators, and trend indicators all in the same chart.
The FOREX market is open 24 hours a day starting from Sunday night until Friday night. The time frame allows traders to trade at convenient times for them. As traders get more experienced they will find the right trading windows to suit their strategies, and they will find the time most trades are being made within different countries market hours.
Below you can see the main FOREX trading times for different markets.
New York: 8am to 5pm. EST
Tokyo: 7pm to 4am. EST
Sydney: 5pm to 2am. EST
London: 3am to 12pm. EST
Looking at the typical operation hours for the different places, we can see there are 3 sessions that overlap. Sydney and Tokyo between 3am-4am EST. London and New York between 8am-12pm EST. The volume in these periods are generally higher but not guaranteed.
FOREX order refers to the way you enter or exit a trade. There are a few different types of orders available we will go through some of them below.
1. Market Order: this will execute the order at the current price. For example, if GBP/USD bid price is 1.375, and the ask price is 1.376, and you execute a buy market order; you would be buying at the price of 1.376.
2. Pending Limit Order: this will execute a buy order below the current market price, or a sell order above the current market price at the specific price you decide. For example, if GBP/USD is currently at 1.350 and you want to go long at 1.330, you can set a buy limit order at 1.330. If the market price hits 1.330, your buy order will automatically open.
3. Pending Stop Order: you use this order type to sell below or buy above the current market price, at a specific price target.
4 .Stop-Loss Order: traders use the stop-loss order to keep them from losing more money if the price goes against their predictions. This type of order is useful if traders can’t watch the price charts all the time, they can set the stop-loss order and know what the maximum loss would be if the trade goes against them.
Pips are a unit of measurement which show the change in value for a currency pair. For example, if GBP/USD is 1.3751, and it moves to 1.3753, that’s a price difference of 0.0002 meaning the price move by 2 pips. Usually a pip is the last or second to last decimal place on a pairs quote.
If the currency pairs quote is more than 4 decimal places then the pip is the second to last decimal place, and the last decimal place will be the point. For example, GBP/USD 1.37512 in this case, the last digit is a point or pipette, and the second to last is a pip.
You should calculate the pip value for each pair you want to trade because each currency value is different against other currencies.
While analysing charts and trends is helpful, you should also look at what causes the price movements in the market. News from around the world is a force of the markets price movement. News affects the decision of many traders and markets, big news events from different countries can really affect the market and break your initial analysis, so it’s better to keep up to date.
When taking a deep dive into the FOREX market, you will examine specific forces that affect currencies price known as fundamental analysis. Looking into and analysing political, economic, and social events that may impact the supply and demand of each currency.
As a FOREX trader, the idea is for you to determine the health of different countries’ economies to see which are stable, and which are struggling. To help you make your analysis on the current state of a country’s economy, you must look into the reasons for events such as rise in unemployment, and other events that have a direct impact.
Fundamental analysis is to try predicting different countries’ future economies. Traders are looking for signs of strength to estimate what their future economy might look like to buy those countries’ currencies.
When analysing countries’ economies, you should be aware of what’s going on in the world which may affect their economy. Forex traders often use an economic calendar to help track different upcoming news events around the world.
Many economic news events are scheduled for release which you will find listed on the FOREX economic calendars, these events are planned with enough time before the release to give traders enough time that fluctuations in the market may be coming. Examples of some news events would be interest rate discussions, employment figures and so on.
Check the economic calendar here: https://www.radexmarkets.com/News/EconomicCalendar
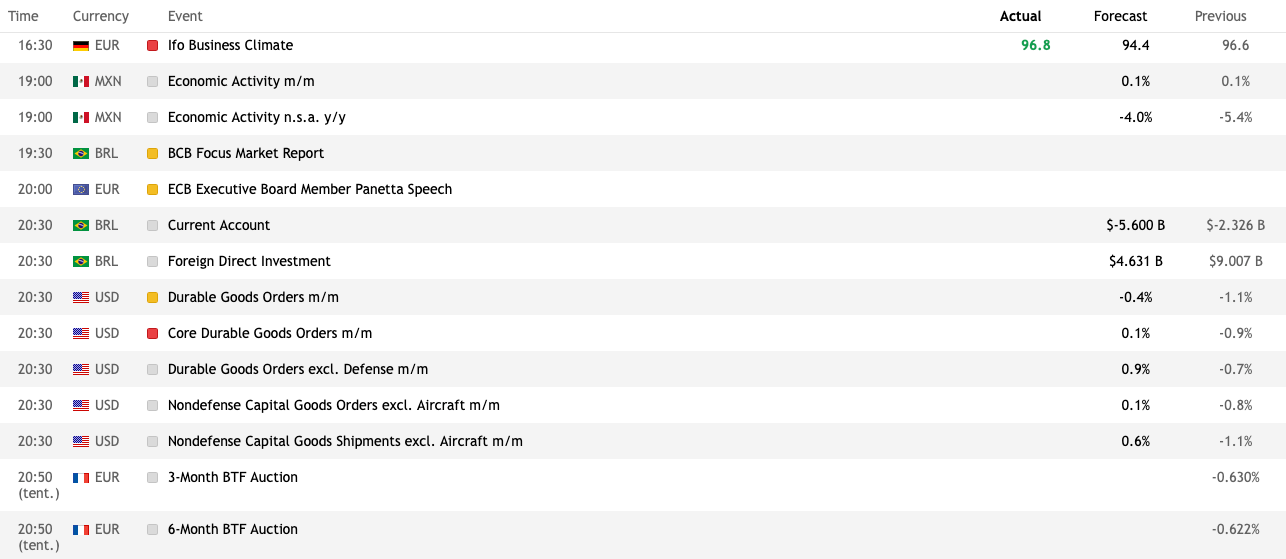
Trading news announcements can be very risky, but also potentially very profitable. Traders first stating out might want to get some more experience and watch market volatility before trying to trade on news announcements. Traders trading news will either enter the trade just before the announcement drops predicting the movement, or wait for the news to drop and see the direction before placing the order.
For example, U.S about to announce the change in interest rates, traders might buy the US dollar before the news drops if they expect an increase in interest rates, and think this will result in the US dollar to increase in price.
Entering the trade before the news is released has its risks that the trend might not go the way you expected. For example, if the US Federal Reserve does not raise the interest rates as expected and you are on the wrong side of the trade, you might not even have time to close the trade manually.
You need the skill and experience to enter your trades at the right time, also you will need a very fast and reliable news feed.
Many news events will make the FOREX market move, but there are a few common news announcements that often lead to big price fluctuations such as FOMC, interest rates, retail figures, consumer price index, and producer price index, to name a few.
World economic news will have different effects on the market, so keep your eye on the news and current events that will have an impact on the markets you are trading.
Fundamental analysis is looking into what makes the market movements, and helps you make the choice about which countries’ currencies are suitable for you to trade. Traders that are going deep into fundamental analysis are usually looking at long term trades.
Increasing your knowledge of the world markets to help you have a better idea about the current state of the global economy is a good takeaway from fundamental analysis when trading FOREX.
Technical Analysis, like fundamental analysis, is a study of price movement, but in technical analysis we look at the past movements to predict the future movements. Many traders use fundamental and technical analysis together to predict how the market is going to move, although some traders only use technical analysis as they believe that all the market variables are based on price movement.
In FOREX, when using technical analysis, we are looking for patterns that repeat multiple times on the chart. The idea is that because the price is moved by people, the patterns will keep repeating as long as it still run by people. We repeat our actions due to emotions and these repetitions can be analysed.
Study trend, support and resistance in FOREX using technical analysis to predict the direction the price will move.
FOREX charts provide the information needed for traders’ analysis, and evaluation of a currency pair movements. Each currency pair is formed of two currencies, so you will need to look into both for a clearer picture.
Keeping an eye on currency price movements is very important if you want to enter a trade at the right time to maximize profits. You can study the price movements from minutes, hours, days, weeks, months, and years; this will help you get a better idea of a currency’s movement.
FOREX charts come in many forms including candlesticks, bar charts, and line charts as we went over previously. First learn the patterns that indicate price movements on each chart type. After you understand how to look for the patterns you can add indicators to the charts to help you spot the forming patterns. Using your knowledge and indicators can help reinforce your trade decision and entry point.
Price trend is basically finding price movement patterns. As you watch of a period of time, you will start to see emerging patterns. Using these patterns you will understand how to predict price movements. Looking to find price trends, or repetitive patterns.
Finding the price trends early is the goal to identify your ideal entry and exit points on the trade. With technical trading, you are solely relaying on the past price movements and no other factors such as news.
You will be wrong sometimes when predicting the price direction, so make sure you have safe guards in place. The better you get at technical analysis, the better your odds get on making the right prediction.
Support and resistance is the main analysis technical traders look for. The traders are looking for price level where they believe the trend momentum should stop and reverse. Resistance is the highest level the price reaches but not breach, and the support is the lowest level the price reaches without breaching. In a crab market the price can move between support and resistance levels, traders will look to buy at support levels and sell at resistance levels.
To determine your ideal entry and exit point for the pair you want to trade, you will need to choose the correct timeframe for your strategy on the FOREX chart. If you are scalping (in and out of a trade in very short periods of time), you will most likely use the 1 minute chart, and if day trading, you could use between the 1 hour to 1 day chart. Indicators are also useful tools to help you clarify the support and resistance levels.
Traders use different methods to analyse support and resistance zones, here are a few examples: Fibonacci, moving averages, pivots, trend lines, candle patterns and many more we will go over in greater detail later.
A breakout as mentioned earlier is when a price passes a support or resistance zone. Using technical analysis, the aim is to predict when a breakout will occur. Three of the most common breakouts are as follows:
• Breakout after a length of price consolidation.
• Breakout from a rising, or falling trend.
• Breakout after a length of shortening price variation.
Traders having different ideas of the fair valuation of a currency makes the market price move between support and resistance, until one side is stronger making the price break the support or resistance. A breakout is often a sign of a new price trend.
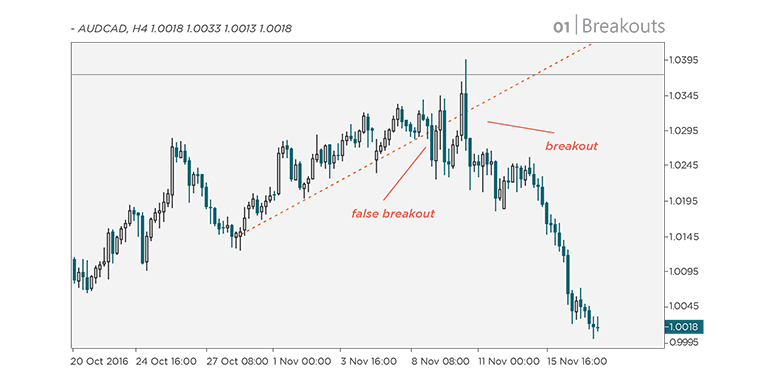
Technical traders often use trend lines to identify their ideal entry and exit points for a trade. To draw the trend lines on your chart, you will run a diagonal line between at least 2 price points. Resistance trend lines will be drawn just above 2 or more points of resistance, and support lines drawn just below 2 or more points of support. Confirm you are using the right timeframe on the chart to correspond with your trading strategy.
Buy at support, and sell at resistance is the goal of technical traders using trend lines, also it’s an useful indicator to see if you believe the trend has been broken.
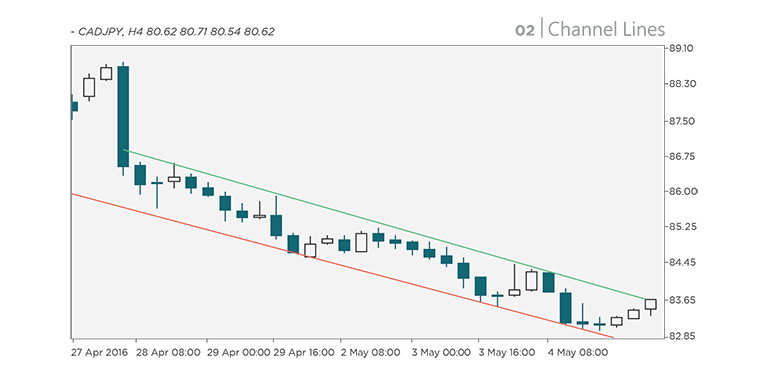
Channel lines are used by traders who trade in short timeframes, aiming to profit on small price movements. Traders draw the channel line parallel to the trend line, using this to pick off the smaller price movements, usually they will buy when the price is close to the trend line, and sell close to the channel line.
Channel lines are also a good indicator for trend weakening. If the price movements fail to hit the channel line, it can be an early sign of a possible incoming trend reversal.
Timeframes indicates the length of time between points on a chart, for example, if you are on the 1 hour chart using the candlestick chart, each candlestick will indicate the movement in a 1 hour period. The chart might still show the movement over days, weeks, and months, however, each individual candle represents 1 hour when you use the 1 hour chart.
When traders are looking to enter a trade, they often start on higher time frames, such as 1 day to identify the long term trend. Then they’d come down the timeframes to find the ideal entry point. Looking at the longer timeframes might not look like much movement, but as you come down the timeframes, you will see all the smaller moves and will have more information to help you maximize the trade’s potential.
What type of trader are you? You will find this out over time once you are trading FOREX. Using demo accounts to test out different strategies is the best way to see where you are comfortable without risking your funds. Below we will go over a few popular strategies.
1. Trend Trading:
Traders following the trend of a currency pair will jump in once the movement is in a strong trend, and stay in as long as possible until it looks like the trend is going to reverse to maximize profit from each trade.
2. Day Trading:
Day traders want to profit from the small fluctuations in price. You will need more time on your hands and watch the charts for immerging patterns and indicators. The idea is to get in profit and out quickly, then move to the next trade.
3. Range Trading:
Range traders are looking to profit in crab markets when the price is bouncing between support and resistance zones. Usually they will put a stop-loss just outside of the support or resistance, just in case the price breaks out into a trend.
4. Breakout Trading:
Looking for potential breakouts that traders can maximize from getting into the trade at the breakout point can lead to potential high profits. You could enter the trade and then set the stop-loss at your risk apatite level, then you could walk away and let the order run.
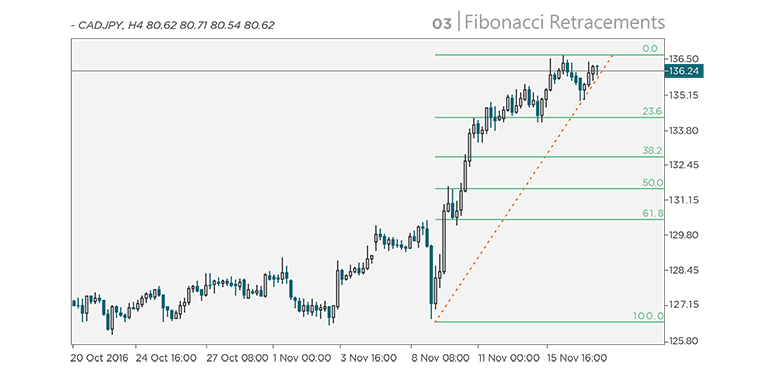
Fibonacci retracements are used by technical traders to predict the duration of corrections within a trend. The values are shown in the form of percentages, with 38.2%, 50%, and 61.8% being the most commonly used retracement levels.
Fibonacci was a mathematician who came across a sequence that has been found in many situations in nature, and basically explained as ‘‘each successive number is the sum of two numbers before it’’. Shown in the following sequence 1,1,2,3,5, so 1+1=2, 1+2=3, 2+3=5, and etc.. Any number is around 0.618 times higher than the number before it, this is where the 61.8% comes from.
As FOXEX is the biggest market in the world, traders believe that it’s close to a natural mechanism. So looking at FOREX this way, you can see why this could be explained by the laws of natural situations.
When drawing Fibonacci retracements, firstly, you need to calculate the pip distance between a few recent high and recent low levels. Next, find the percentages of the distance and mark the corresponding retracement levels. For example, you measure a distance of 100 pips, so 38% would be 38pips, 50% would be 50 pips, and 61.8% would be 61.8 pips. Next step is to take away the calculated pips from the high point for upwards move; for a downwards move, add the calculated pips to the low point.
Traders often use multiple TA tools, and then use Fibonacci retracement to confirm their analysis, see the example shown below.
Technical Analysis traders in most cases believe that there is no profitable way to trade the news as the fundamental traders’ attempt. TA traders see how quickly the market moves so any news will show on the chart, so they will react to the chart instead of the news.
A few benefits of technical analysis are listed below.
•Determine your exact entry and exit points, which is not as easy if you are just relying on news to make the moves. You can analyse the charts to see strong trends and points of interest.
• Plenty of tools in the form of chart indicators to help you confirm your chart analysis.
When using technical analysis to make your trades, you’d still need to give attention to other factors that may impact your trade. It’s better to put safety precautions in place, just in case the trade doesn’t go as planned.
Learning Charts, analysis, indicators, and different strategies can help you to become a good trader. Having great long term FOREX trading experience, the mindset and healthy trading psychology are also important. Make rational trading decisions and try not to let you emotion run the trade.
Creating a trading plan can be a big help. Make the rules you must meet to enter/exit a trade and you should stick to them. A concrete trading plan will help keep the emotion out of the trade, but it’s easy for traders to slip, so you have to be disciplined.
Taking a loss can be a massive knock to the confidence, and you might slip into the trap of what some call ‘‘revenge trading,’’ trying to recover the loss and throwing the plan out of the window; this can be dangerous.
Winning streaks can make traders over confident and might end up steering away from the plan, and possibly opening bigger trades; this may lead to unexpected risks.
Being disciplined is very important to become a good trader. Knowing when to leave a trade if it isn’t going to plan as you won’t always be right, and you can’t always get your maximum profit expectations. Think long term, you don’t need to jump on every possible trade. Stick to the plan and make sure each trade meets your criteria, then you will be on your way to becoming a successful trader.
Risk management is of the upmost importance when trading. Put precautions in place to minimise potential losses. You will make a loss on some trades but it’s how you manage the loss that makes a difference.
Utilising tools on the trading platform, such as Stop-Loss can greatly help you control risk. Putting a Stop-Loss in place as per your analysis and risk ratio can help you stick to your trade plan if you don’t move it. It’s also very helpful for traders to exit the trade and not occur extra loss especially if you are away from the chart.
Determine what percentage of the balance you a willing to lose on a trade before entering the position. This will help you to take away a level of emotion from the trade. If the price hits your max loss target, then your original analysis maybe void. You can then exit the trade without losing more than you allow.
Evaluate your strategy regularly. Your trading strategy might have been working well but suddenly keeps missing. Market conditions change rapidly so you might need to tweak or change parts of the strategy from time to time, to make sure that you keep on top of it.
When you are all prepared and once you have practiced, and found a trading style that works for you, it might be time to open a real trading account. First of all, you will need to pick a broker. There are a lot of brokers to choose from so below are a few key points to consider when deciding.
• Checking the broker is regulated from a regulation authority.
• Checking spread offers: are the spreads fixed or floating and which is best for your strategy?
• What leverage options does the broker have? It’s better to start on lower leverage for new traders and you can increase it as you become more professional.
• What are the Swap fees (overnight rollover fees)? If you plan to hold trades for longer periods of time, you should take this into consideration.
• What offers and services does the broker provide?
• What trading platforms are available for use under the broker?
➤ Find at least two brokers that you think may fit your criteria, then open demo accounts with them to compare features, costs, and services.
Different brokers have different requirements, some more so than others. Ideally, you’d want a broker with a good user experience and tools to help you out.
Usually brokers have more than one account types. For example, one account type could be purely spread based, and another with lower spread and a commission fee. Make sure to choose the right account for your needs.
After entering your details to open an account, you will need to upload a proof of ID, e.g. Passport, or local government issued ID, and a proof or address, e.g. Utility bill, or Bank Statement. Once the broker has verified your account, you will be good to go.
Remember, always stick to your plan, manage risks and learn from experiences, then you’ll be able to keep evolving and become a successful trader.
คำเตือนความเสี่ยง : การซื้อขายตราสารอนุพันธ์และผลิตภัณฑ์ที่มีเลเวอเรจมีความเสี่ยงสูง
เปิดบัญชี


